
In this article let us see: how to calculate cholesterol ratios, total cholesterol to hdl ratio chart, triglyceride to hdl ratio insulin resistance, ldl hdl ratio heart disease risk, what is a good cholesterol ratio.
Cholesterol Ratios: Comprehensive Guide to Ideal Ranges and Heart Risk
Your total cholesterol number only tells a small part of your cardiovascular health story. Medical research reveals that cholesterol ratios are a much more accurate predictor of heart attack, stroke, and insulin resistance than individual lipid numbers alone.
A cholesterol ratio measures the balance between different types of fats in your bloodstream. By looking at these balances, your healthcare provider can determine whether you have a protective level of "good" cholesterol to offset the risks of "bad" cholesterol.
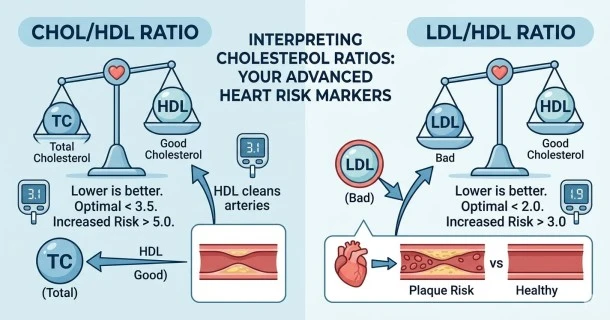
1. Total Cholesterol to HDL Ratio (TC/HDL)
The Total Cholesterol to HDL ratio captures the exact balance between all circulating cholesterol and the fraction actively working to clear it from your arteries.
How to Calculate TC/HDL
Divide your Total Cholesterol number by your HDL ("good") cholesterol number.
- Example: If your Total Cholesterol is 200 mg/dL and your HDL is 50 mg/dL, your ratio is 4.0 (200 ÷ 50 = 4).
TC/HDL Target Ranges and Risk Chart
Because women naturally tend to have higher HDL levels than men, the ideal targets vary by sex:
| Risk Category | Men's Range | Women's Range | Heart Health Meaning |
| Ideal | Less than 3.5 | Less than 3.0 | Strong cardiovascular protection; optimal balance |
| Moderate | 3.5 to 5.0 | 3.0 to 4.4 | Standard range; moderate baseline heart risk |
| High Risk | More than 5.0 | More than 4.4 | Elevated risk of arterial plaque buildup (atherosclerosis). |
Note: Data from the historic Framingham Heart Study shows that a TC/HDL ratio of 9.6 in men and 7.0 in women doubles a person's average risk of developing heart disease.
2. Triglyceride to HDL Ratio (TG/HDL)
The Triglyceride to HDL ratio is a powerful modern marker used to predict metabolic syndrome, insulin resistance, and the specific physical shape of your LDL particles.
Why the TG/HDL Ratio Matters
This calculation acts as a window into your LDL phenotype:
- Pattern A (Low Ratio): Indicates large, fluffy, buoyant LDL particles that bounce off artery walls harmlessly.
- Pattern B (High Ratio): Indicates small, dense LDL particles (sdLDL). These tiny particles easily penetrate the arterial lining, oxidize quickly, and form dangerous plaque.
TG/HDL Target Ranges
Keep your fasting triglycerides under 150 mg/dL and your HDL above 40–50 mg/dL to maintain a safe ratio:
- Ideal (Pattern A): Less than 2.0 (Highly optimal for insulin sensitivity)
- Borderline: 2.0 to 3.8 (Early signs of metabolic sluggishness)
- High Risk (Pattern B): More than 3.8 (Strongly correlates with insulin resistance and aggressive cardiovascular risk)
3. LDL to HDL Ratio (LDL/HDL)
The LDL to HDL ratio isolates your primary "bad" cholesterol against your "good" cleanup crew to look specifically at cholesterol transport safety.
How to Calculate LDL/HDL
Divide your LDL cholesterol value by your HDL cholesterol value.
Example: If your LDL is 125 mg/dL and your HDL is 50 mg/dL, your ratio is 2.5 (125 ÷ 50 = 2.5).
LDL/HDL Target Ranges
- Ideal: Less than 2.5
- Moderate: 2.5 to 3.3
- High Risk: More than 3.3 (Indicates a heavy burden of plaque-building particles)
How to Improve Maladaptive Cholesterol Ratios
If your lab report reveals a moderate or high-risk cholesterol ratio, targeted daily changes can shift your metrics back into balance:
- Lower Triglycerides: Reduce your intake of refined carbohydrates, ultra-processed grains, and added sugars. Minimize alcohol intake, as alcohol directly spikes VLDL and triglyceride production.
- Raise HDL Cholesterol: Incorporate consistent aerobic exercise or high-intensity interval training (HIIT) into your week. Consume healthy fats rich in omega-3 fatty acids, such as olive oil, avocados, and wild-caught fish.
- Track Non-HDL Cholesterol: Calculate your Non-HDL value (Total Cholesterol minus HDL). Clinical guidelines favor keeping your Non-HDL cholesterol below 130 mg/dL to ensure total protection across all atherogenic particle types.
Frequently Asked Questions (FAQ)
What is the most important cholesterol ratio to track?
While doctors historically relied heavily on the Total Cholesterol to HDL (TC/HDL) ratio, modern preventative cardiologists place a massive emphasis on the Triglyceride to HDL (TG/HDL) ratio. The TG/HDL ratio is uniquely effective because it screens for underlying insulin resistance, pre-diabetes, and the presence of highly dangerous small, dense LDL particles.
Can I have a high cholesterol ratio if my total cholesterol is normal?
Yes, this is a common clinical paradox. If your total cholesterol is a seemingly healthy 180 mg/dL, but your HDL is very low at 30 mg/dL, your TC/HDL ratio is 6.0. This places you squarely in the high-risk category, proving that individual metrics can sometimes mask severe cardiovascular vulnerabilities.
How long does it take to improve your cholesterol ratios?
With targeted lifestyle changes—including a lower-carbohydrate diet, daily exercise, and weight management—notable changes in your triglyceride and HDL markers can be observed on follow-up blood tests within 6 to 12 weeks.