
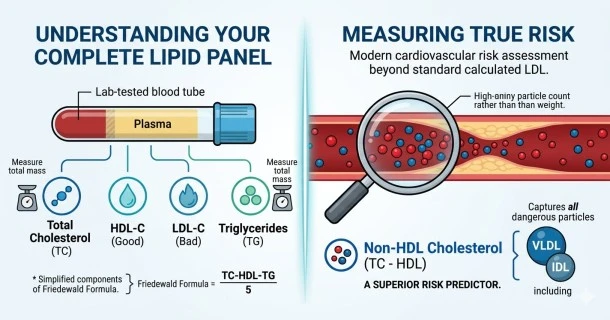
In this article let us see: what is a normal cholesterol range, healthy cholesterol chart by numbers, high triglycerides to hdl ratio, understanding my lipid panel results, non-hdl cholesterol targets.
Healthy Cholesterol Levels: How to Read Your Complete Lipid Panel Chart
When you receive a cholesterol blood test, seeing a single total number is not enough to evaluate your true cardiovascular condition. Your body naturally produces cholesterol to repair cell membranes, synthesize vital hormones, and heal underlying systemic inflammation. To understand if your numbers are healthy, you must look at the balance of all individual components traveling in your blood.
The Master Cholesterol Levels Chart: Normal vs. High Ranges
A standard diagnostic lipid profile splits your blood fats into four distinct categories. While clinical labs traditionally use milligrams per deciliter (mg/dL), international standards often utilize millimoles per liter (mmol/L).
1. Total Cholesterol (TC) Range
Total cholesterol measures the absolute sum of all fat carried across all circulating lipoproteins in your body.
- Normal Range: Less than 200 mg/dL (< 5.2 mmol/L) — Indicates optimal systemic baseline balance.
- Borderline Range: 200 to 239 mg/dL (5.3 to 6.2 mmol/L) — A warning zone suggesting a need for lifestyle evaluation.
- High Range: 240 mg/dL and above (> 6.2 mmol/L) — Correlates with elevated vascular plaque development risks.
2. LDL Cholesterol (LDL-C) Range
Low-Density Lipoprotein is widely called "bad" cholesterol because it drops off fats into body tissue, though its primary function is basic cellular nutrient delivery.
- Normal Range: Less than 130 mg/dL (< 3.36 mmol/L) — Safe for individuals without underlying pre-existing conditions.
- Borderline Range: 130 to 159 mg/dL (3.36 to 4.11 mmol/L) — Suggests early plaque accumulation risk.
- High Range: 160 mg/dL and above (> 4.11 mmol/L) — Strongly tied to increased arterial thickening.
3. HDL Cholesterol (HDL-C) Range
High-Density Lipoprotein acts as your body's clean-up crew. It gathers excess vascular fat and pulls it safely back to the liver for waste breakdown.
- Optimal Protective Level: More than 60 mg/dL (> 1.55 mmol/L) — Actively shields your cardiovascular system.
- Acceptable Borderline Level: 40 to 60 mg/dL (1.03 to 1.55 mmol/L) — Moderate clearing capacity.
- High-Risk Low Level: Less than 40 mg/dL (< 1.03 mmol/L) — Insufficient clearance, increasing heart disease risk.
4. Triglycerides (TG) Range
Triglycerides are direct chemical energy stores derived from food calories.
- Normal Range: Less than 150 mg/dL (< 1.69 mmol/L) — Indicates efficient carbohydrate and fat metabolism.
- Borderline Range: 150 to 199 mg/dL (1.69 to 2.25 mmol/L) — Often signals early insulin resistance or high carbohydrate intake.
- High Range: 200 mg/dL and above (> 2.25 mmol/L) — Heightens the probability of metabolic syndrome.
Beyond the Basics: 2 Critical Ratios to Calculate From Your Results
Isolated numbers can sometimes be misleading. For instance, you could have a slightly elevated total cholesterol score driven entirely by an exceptionally high, protective HDL level. To see your true risk profile, calculate these two advanced markers directly from your lab printout:
The TG to HDL-C Ratio
Your Triglyceride-to-HDL ratio is one of the most reliable predictors of insulin resistance and heart health. A high ratio tells your doctor that your body likely contains small, dense, dangerous LDL particles.
- Healthy Target: Maintain a ratio below 3.0 (for women) or below 3.5 (for men).
- Moderate Risk: 3.0 to 4.4 (women) or 3.5 to 5.0 (men).
- High Risk: Anything over 4.4 (women) or 5.0 (men).
Non-HDL Cholesterol
Calculating your Non-HDL score is straightforward: subtract your HDL ("good") value from your Total Cholesterol number. Clinical trials prove this calculation predicts future cardiac incidents far better than standard LDL alone because it tracks every single plaque-forming particle in your blood.
- Normal Target: Less than 130 mg/dL (< 3.3 mmol/L).
- Borderline Warning: 130 to 159 mg/dL (3.3 to 4.1 mmol/L).
- High Cardiovascular Risk: 160 mg/dL and above (> 4.1 mmol/L).
Root Causes of Shifts in Blood Cholesterol Numbers
If your blood screening flags high markers, look beyond dietary fat intake. Raised lipid values are frequently a biological symptom rather than a primary disease. The liver naturally increases cholesterol production to combat underlying issues like systemic inflammation, chronic bacterial or viral infections, and high toxic loads.
Furthermore, poor lifestyle habits like chronic sleep deprivation, prolonged psychological stress, and physical inactivity alter thyroid performance and directly skew metabolic markers.
Actionable Management and Treatment Strategies
If your medical practitioner recommends lowering your cardiovascular risks, multiple avenues can improve your blood lipid profile:
- Dietary and Lifestyle Refinements: Transition away from refined carbohydrates and simple sugars, as reducing carb intake is the single fastest way to bring down high triglycerides. Incorporate healthy fats rich in omega-3 fatty acids, such as wild fish, flaxseed oil, and walnuts. Regular exercise also directly increases your protective HDL levels.
- Alternative and Complementary Approaches: Many people successfully incorporate natural modalities alongside regular healthcare routines. These options include herbal therapies, standard homeopathic protocols, dedicated yoga practices, targeted acupressure, and reflexology to lower systemic stress.
- Clinical Interventions: When lifestyle adjustments do not fully normalize high-risk profiles, prescription medications may be recommended by your doctor to lower systemic production.
Frequently Asked Questions (FAQ)
Why is my total cholesterol high if my diet is low in fat?
Your liver produces roughly 75% to 80% of the cholesterol circulating in your bloodstream. When your body experiences systemic inflammation, hidden infections, or high emotional stress, your liver steps up its internal production to help heal tissue and fight toxins. Additionally, eating too many refined carbohydrates causes your liver to manufacture excess triglycerides, inflating your total numbers regardless of dietary fat intake.
What does a high TG/HDL-C ratio mean on a blood test?
Your Triglyceride-to-HDL ratio measures metabolic efficiency. A high ratio (above 3.0 for women or 3.5 for men) strongly implies that your body is dealing with insulin resistance or metabolic syndrome. Clinically, this high ratio indicates that your LDL particles are likely small, dense, and highly inflammatory, which allows them to easily breach your arterial linings and form plaque.
Why is Non-HDL a better health marker than standard LDL?
Non-HDL cholesterol is calculated by subtracting your protective HDL from your total cholesterol number. Standard LDL tests can miss dangerous elements. Non-HDL captures every single plaque-promoting particle moving through your circulatory system, including LDL, VLDL, and intermediate fragments. This gives your doctor a complete, reliable picture of your real cardiac risk.
Can natural treatments or lifestyle changes really lower high triglycerides?
Yes, lifestyle habits heavily influence triglyceride markers. Because triglycerides are stored sugar energy, cutting down on simple carbohydrates, alcohol, and processed grains causes these numbers to drop rapidly. Adding omega-3 fatty acids from fish or flaxseed oil and engaging in consistent cardiovascular exercise directly accelerates this clearance while simultaneously raising your protective HDL numbers.