
Learn how the A1C test measures your 3-month blood sugar average. Discover the official ADA targets, how to convert A1C to eAG, and what causes false test errors.
Understanding Your A1C Test: The Ultimate Guide to Goals, eAG, and Accuracy
The Hemoglobin A1C test (also known as HbA1c, glycated hemoglobin, or hemoglobin A1c) is the gold-standard medical tool used to diagnose prediabetes and diabetes, as well as monitor how effectively a diabetes treatment plan is working.
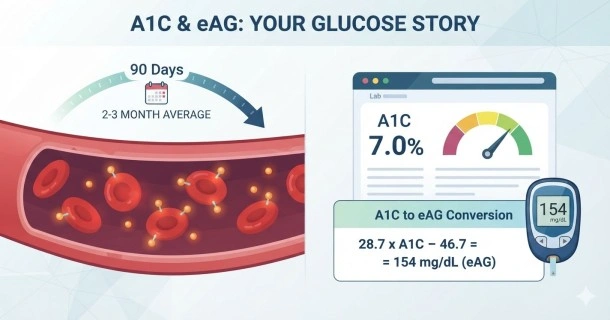
When glucose builds up in your blood, it naturally sticks to hemoglobin—a vital protein inside your red blood cells (RBCs) that carries oxygen throughout your body. This irreversible chemical bonding process is called glycation. Because red blood cells have an average lifespan of about 90 to 120 days, your A1C test provides a clear, stable snapshot of your average blood sugar levels over the past 2 to 3 months.
Glycation vs. Glycosylation: What Is the Difference?
It is common to confuse these two terms, but they represent entirely different biological mechanisms:
- Glycosylation is a controlled, enzymatic process where the body purposefully attaches a carbohydrate to a protein or lipid for normal cell function, such as ensuring proper protein folding and stability.
- Glycation is a random, non-enzymatic process where excess blood glucose spontaneously sticks to proteins. Chronic high blood sugar (hyperglycemia) accelerates glycation, leading to the formation of Advanced Glycation End-products (AGEs). Over time, AGE accumulation damages blood vessels, nerves, and organs, increasing the risk of diabetic complications like blindness, kidney disease, and vascular damage.
A1C & eAG: The Blood Glucose Relationship
While your A1C test is reported as a percentage, daily self-monitoring of blood glucose (SMBG) via finger-sticks or continuous glucose monitors (CGM) is tracked in milligrams per deciliter (mg/dL) or millimoles per liter (mmol/L).
To bridge this gap, the American Diabetes Association (ADA) utilizes Estimated Average Glucose (eAG). This metric mathematically translates your A1C percentage into the familiar units used on standard glucose meters. The relationship is calculated using the clinical formula: eAG (mg/dL) = (28.7 × A1C) − 46.7.
A1C to eAG Conversion Chart
| A1C Result (%) | Estimated Average Glucose (eAG) in mg/dL | Estimated Average Glucose (eAG) in mmol/L | Clinical Classification |
|---|---|---|---|
| 5.0% | 97 mg/dL | 5.4 mmol/L | Normal |
| 5.7% | 117 mg/dL | 6.5 mmol/L | Prediabetes Borderline |
| 6.0% | 126 mg/dL | 7.0 mmol/L | Prediabetes |
| 6.5% | 140 mg/dL | 7.8 mmol/L | Diabetes Diagnostic Threshold |
| 7.0% | 154 mg/dL | 8.6 mmol/L | Target for Most Diabetic Adults |
| 8.0% | 183 mg/dL | 10.2 mmol/L | Action Required / Pre-surgery Limit |
| 9.0% | 212 mg/dL | 11.8 mmol/L | High Risk of Complications |
The Clinical Benefits of the A1C Test
The A1C assay offers several major advantages over traditional fasting plasma glucose tests:
- No Fasting Required: You can take the blood test at any time of day, regardless of when you last ate.
- Reflects Long-Term Trends: It evaluates your multi-month average rather than a single moment in time, meaning it cannot be skewed by temporary factors like a high-carbohydrate meal, an isolated episode of acute stress, or minor infections.
- Predicts Health Complications: Decades of clinical research prove that your A1C number is the most reliable marker for assessing your long-term risk of developing microvascular damage (nerve, eye, or kidney disease).
Note: For complete diabetes management, the ADA recommends balancing your A1C test with daily real-time monitoring (SMBG or CGM). A1C measures your average, but daily monitoring detects real-time dangerous spikes (hyperglycemia) or dangerous drops (hypoglycemia).
Healthy A1C Goals: What Should You Aim For?
According to the official ADA Standards of Care in Diabetes guidelines, glycemic targets must be highly individualized based on age, lifestyle, and overall health status:
- For General Diagnosis: An A1C below 5.7% is normal. A range of 5.7% to 6.4% indicates prediabetes. A level of 6.5% or higher on two separate tests confirms a diagnosis of diabetes.
- For Most Non-Pregnant Adults: The standard therapeutic target is under 7.0% (an eAG of ~154 mg/dL). This balance effectively minimizes vascular complications while avoiding severe low blood sugar.
- Tight Glycemic Control (<6.5%): A lower target may be recommended for individuals who are younger, newly diagnosed, or managing their condition purely through lifestyle or medications that carry a low risk of hypoglycemia.
- Relaxed Control (<8.0%): A less stringent target is often appropriate for older adults, individuals with a history of severe hypoglycemia, advanced microvascular complications, or limited life expectancy where the risks of strict treatment outweigh the rewards.
Critical A1C Test Errors & Interferences
While the A1C test is highly reliable, certain underlying medical conditions alter the average lifespan of your red blood cells, triggering falsely high or low results that do not accurately reflect your actual blood sugar control.
Factors Causing Falsely Low A1C Results
- Shortened RBC Lifespan: Conditions where red blood cells are destroyed or replaced too quickly mean the hemoglobin has less time to undergo glycation. Examples include hemolytic anemia, major blood loss (hemorrhage), recent blood transfusions, or the use of erythropoietin therapy.
- Pregnancy: Rapid red blood cell turnover and altered blood volume during pregnancy naturally lower A1C values.
- Chronic Conditions: Severe liver cirrhosis or heavy alcohol consumption can distort structural readings.
Factors Causing Falsely High A1C Results
- Prolonged RBC Lifespan: When red blood cells stick around longer than normal, they accumulate more glucose over time. The most common cause is iron deficiency anemia, as well as vitamin B12 or folate deficiencies.
- Splenectomy: Surgical removal of the spleen reduces the body's natural filtering of older red blood cells, falsely inflating the average cell age.
Hemoglobin Variants
Inherited structural variants of hemoglobin—such as the HbS (sickle cell trait), HbC, HbE, or HbD traits—can significantly interfere with specific laboratory testing methods. If you belong to an ethnic minority population where these traits are more prevalent, or if your daily finger-stick data completely contradicts your laboratory A1C result, ask your healthcare team to run an A1C assay certified by the National Glycohemoglobin Standardization Program (NGSP) or consider alternative markers like glycated albumin or continuous glucose monitoring (CGM) Time-in-Range.
Frequently Asked Questions (FAQ)
Does a high A1C mean I definitely have diabetes?
An A1C level of 6.5% or higher indicates diabetes, but a single test should always be confirmed with a second test or an alternative method (like a fasting plasma glucose test) before a formal clinical diagnosis is made.
Can I lower my A1C quickly?
Because your A1C measures a 3-month cellular average, it cannot change overnight. Sustainable reductions require consistent adjustments to nutrition, regular physical activity, and proper medication management over a 90-day cycle.
Why does my daily glucose meter average look lower than my eAG?
Standard finger-stick meters often capture your blood sugar at specific moments, such as right before meals when levels are naturally lower. They may miss post-meal glucose spikes or overnight elevations that an A1C test automatically includes in its overall average.