
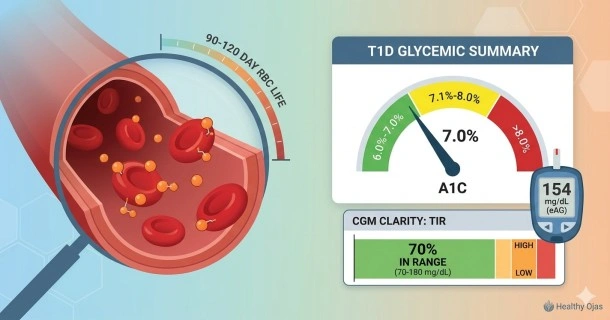
Learn how the A1C test evaluates Type 1 diabetes. Understand official ADA targets by age, eAG conversion formulas, and why A1C misses severe lows.
Understanding Your A1C Test with Type 1 Diabetes: Goals, eAG, and Glycemic Variability
The Hemoglobin A1C test (HbA1c) is a cornerstonemedical tool for evaluating long-term glucose management in Type 1 Diabetes (T1D). Because Type 1 diabetes is an autoimmune condition characterized by the absolute absence of endogenous insulin, managing daily blood glucose levels is a complex balancing act.
When glucose builds up in the bloodstream, it naturally attaches to hemoglobin—the oxygen-carrying protein inside your red blood cells (RBCs). This irreversible chemical process is known as glycation. Since red blood cells circulate in the body for an average lifespan of 90 to 120 days, the A1C test provides a stable snapshot of your average blood sugar levels over the past 2 to 3 months.
However, for individuals living with Type 1 diabetes, looking strictly at the average can mask critical daily fluctuations. To manage T1D safely and effectively, it is essential to understand how your A1C relates to daily clinical metrics, individualized targets, and potential testing limitations.
Glycation vs. Glycosylation in Type 1 Diabetes
It is common to confuse these two terms, but they represent entirely different biological mechanisms:
- Glycosylation is a highly controlled, enzymatic process where the body purposefully attaches a carbohydrate to a protein or lipid structure. This normal, healthy cell function is required for proper protein folding, stability, and cellular communication.
- Glycation is a random, non-enzymatic process where excess blood glucose spontaneously sticks to proteins like hemoglobin.
In Type 1 diabetes, periods of severe hyperglycemia (high blood sugar) rapidly accelerate glycation. Over time, these glycated proteins degrade into Advanced Glycation End-products (AGEs). Accumulation of AGEs structurally damages delicate blood vessels, nerve endings, and vital organs, directly contributing to long-term microvascular complications such as diabetic retinopathy (eye damage), nephropathy (kidney disease), and neuropathy (nerve damage).
T1D A1C & eAG: The Blood Glucose Relationship
While a laboratory A1C test delivers results as a percentage, your day-to-day choices—such as calculating insulin-to-carbohydrate ratios and correcting highs—rely on active glucose numbers. Daily self-monitoring of blood glucose (SMBG) via finger-sticks or continuous glucose monitors (CGM) is tracked in milligrams per deciliter (mg/dL) or millimoles per liter (mmol/L).
To bridge this data gap, the American Diabetes Association (ADA) utilizes Estimated Average Glucose (eAG). The eAG mathematically converts an abstract A1C percentage into the familiar tracking units seen on standard glucose hardware. This relationship is defined by the clinical formula: eAG (mg/dL) = (28.7 × A1C) − 46.7.
Type 1 Diabetes A1C to eAG Conversion Chart
| A1C Result (%) | Estimated Average Glucose (eAG) in mg/dL | Estimated Average Glucose (eAG) in mmol/L | Clinical Context & Interpretation |
| 5.7% | 117 mg/dL | 6.5 mmol/L | Non-diabetic reference baseline |
| 6.0% | 126 mg/dL | 7.0 mmol/L | Highly optimal T1D control (if achieved safely) |
| 6.5% | 140 mg/dL | 7.8 mmol/L | Excellent target control for many T1D adults |
| 7.0% | 154 mg/dL | 8.6 mmol/L | Standard ADA Target for most non-pregnant adults |
| 7.5% | 169 mg/dL | 9.4 mmol/L | Relaxed target for pediatric populations / older adults |
| 8.0% | 183 mg/dL | 10.2 mmol/L | Indicates elevated risk of microvascular complications |
| 9.0% | 212 mg/dL | 11.8 mmol/L | High risk; immediate insulin regimen review advised |
The Downside of A1C in T1D: Glycemic Variability
A significant clinical limitation of relying solely on the A1C test in Type 1 diabetes management is its inability to measure glycemic variability—the rapid, erratic swings between extreme highs (hyperglycemia) and dangerous drops (hypoglycemia).
Because A1C is purely a mathematical average, two people can have an identical A1C result of 7.0%, yet possess completely different daily clinical profiles:
- Patient A has highly stable, predictable blood sugars that consistently float near 154 mg/dL.
- Patient B experiences severe nighttime lows dropping into the 40 mg/dL range, balanced out by severe post-meal spikes surging over 280 mg/dL.
While Patient B's lab report shows a "target" 7.0% A1C, their high glycemic variability places them at acute risk for severe hypoglycemia episodes and clinical distress.
Moving Beyond A1C: Time in Range (TIR)
To offset this limitation, modern diabetes care pairs the A1C test with Continuous Glucose Monitor (CGM) metrics. Clinicians highly prioritize Time in Range (TIR)—the percentage of time your blood sugar spends within a safe target window (typically 70 to 180 mg/dL).
The consensus clinical goal for most adults with Type 1 diabetes is a Time in Range of greater than 70%, while keeping time spent below 70 mg/dL (hypoglycemia) to less than 4%. Balancing a stable A1C with a high TIR ensures that your long-term microvascular safety is achieved without compromising immediate physical safety.
Healthy A1C Goals: Tailoring Targets for Type 1 Diabetes
The American Diabetes Association (ADA) emphasizes that therapeutic A1C targets for Type 1 diabetes must be carefully individualized across different age brackets and life circumstances:
- Non-Pregnant Adults: The general recommended target is under 7.0% (an eAG of ~154 mg/dL). Clinical evidence demonstrates this threshold significantly lowers the long-term incidence of microvascular complications.
- Children and Adolescents: The modern ADA guideline aligns pediatric targets to under 7.0% as well, provided the child has access to comprehensive diabetes technology (like CGMs and automated insulin delivery systems) and can meet this target without experiencing frequent or severe low blood sugars.
- Strict Control (<6.5%): May be appropriate during early post-diagnosis "honeymoon phases" or for individuals utilizing advanced hybrid closed-loop pumps who experience minimal hypoglycemia.
- Relaxed Control (<8.0%): A more lenient target is clinically indicated for individuals with a history of hypoglycemia unawareness (inability to feel low blood sugar symptoms), frequent severe nocturnal lows, advanced microvascular complications, or limited lifespan where aggressive dosing risks outweigh potential long-term benefits.
Critical A1C Test Errors & Interferences in T1D
While the laboratory A1C assay is generally highly standardized, several physiological factors can falsely skew your results, making your diabetes management appear better or worse than it truly is.
Factors Causing Falsely Low A1C Results
When red blood cells are destroyed or replaced too quickly, hemoglobin has less exposure time to circulating glucose, artificially depressing your A1C percentage:
- Frequent Severe Hypoglycemia: An abundance of low blood sugar events lowers the overall pool of circulating glucose, dropping the average out of proportion to actual day-to-day high spikes.
- Shortened RBC Lifespan: Conditions such as hemolytic anemia, recent major blood loss, or blood transfusions alter standard cell cycles.
- Pregnancy: Rapid red blood cell turnover naturally lowers true A1C metrics during pregnancy.
Factors Causing Falsely High A1C Results
When red blood cells survive longer than the typical 90-to-120-day window, they accumulate excess glucose over their extended lifespan, inflating your A1C result:
- Iron Deficiency Anemia: A lack of iron prolongs old red blood cell survival, leading to an artificially high A1C that does not reflect actual blood sugar levels. Vitamin B12 or folate deficiencies operate similarly.
- Splenectomy: Surgical removal of the spleen impairs the body's ability to clear out older, highly glycated red blood cells.
Hemoglobin Variants
Inherited variants in hemoglobin structure—such as the HbS (sickle cell trait), HbC, HbE, or HbD traits—can directly interfere with certain laboratory diagnostic methods. If your daily CGM data or finger-stick averages drastically contradict your quarterly lab results, consult your endocrinologist. Your healthcare team can order an assay certified by the National Glycohemoglobin Standardization Program (NGSP) that bypasses hemoglobin variants, or evaluate alternative glycemic markers such as glycated albumin or fructosamine tests.
Frequently Asked Questions (FAQ)
Why does my A1C test result differ from my CGM’s "Glucose Management Indicator" (GMI)?
Your CGM calculates GMI based on continuous tissue fluid readings over a strict 14-to-90-day window. A laboratory A1C is a direct blood analysis influenced by the exact structural life cycle of your red blood cells over a full 90-to-120-day period. Slight differences are normal, but large discrepancies warrant checking for underlying issues like anemia.
Can I use diet and lifestyle alone to lower my A1C in Type 1 diabetes?
While healthy nutrition and physical activity optimize insulin sensitivity and help flatten post-meal spikes, Type 1 diabetes requires life-sustaining basal and bolus insulin therapy. Lifestyle adjustments complement, but can never replace, precise insulin dosing.
How often should an individual with Type 1 diabetes have their A1C tested?
The ADA recommends that individuals meeting their therapeutic goals and maintaining stable glycemic control undergo testing at least twice a year. For those adjusting insulin regimens, changing delivery technologies, or not meeting clinical targets, testing should be conducted quarterly (every 3 months).