
Discover how the A1C test measures insulin resistance and monitors Type 2 diabetes. Learn official ADA goals, steps for T2D remission, and common false testing errors.
Understanding Your A1C Test with Type 2 Diabetes: Goals, eAG, and Metabolic Health
The Hemoglobin A1C test (HbA1c) is the definitive clinical tool used to diagnose, monitor, and manage Type 2 Diabetes (T2D). Unlike Type 1 diabetes, which is an autoimmune destruction of insulin-producing cells, Type 2 diabetes is a progressive metabolic condition characterized by insulin resistance—a state where the body's cells do not respond effectively to insulin, causing glucose to build up in the bloodstream.
When blood sugar levels remain chronically elevated, glucose molecules spontaneously attach to hemoglobin, the oxygen-carrying protein inside your red blood cells (RBCs). This irreversible chemical binding process is called glycation. Because red blood cells have a natural lifespan of roughly 90 to 120 days, the A1C test provides a highly stable, reliable look at your average blood sugar levels over the past 2 to 3 months.
For individuals managing Type 2 diabetes, tracking your A1C is essential for evaluating the success of lifestyle interventions, oral medications, weight-loss goals, and long-term metabolic health.
Glycation vs. Glycosylation: The Molecular Difference
It is common to confuse these two terms, but they represent entirely different biological processes:
- Glycosylation is a controlled, enzymatic process where the body purposefully attaches a carbohydrate to a protein or lipid. This is a normal and necessary mechanism for healthy cell structure, protein folding, and overall cellular communication.
- Glycation is a random, non-enzymatic process where excess blood glucose spontaneously glues itself to structural proteins.
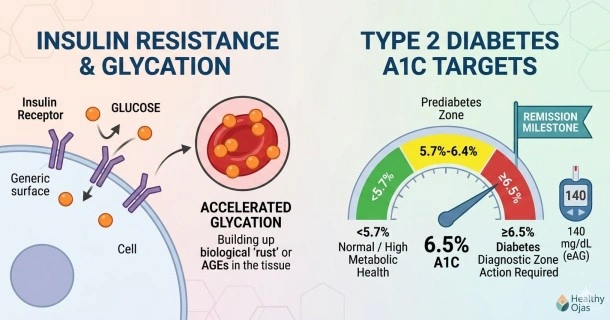
In Type 2 diabetes, chronic insulin resistance causes prolonged spikes in blood glucose, which radically accelerates glycation throughout the body. Over time, these glycated proteins degrade into harmful compounds known as Advanced Glycation End-products (AGEs). The buildup of AGEs acts like biological rust, stiffening and damaging delicate blood vessels, nerve pathing, and organ tissues. This is the exact underlying mechanism behind classic diabetic complications, including kidney damage (nephropathy), vision loss (retinopathy), and cardiovascular disease.
T2D A1C & eAG: The Blood Glucose Relationship
While a laboratory A1C result is delivered as a percentage, your daily tracking at home—whether through traditional finger-stick blood glucose meters or Continuous Glucose Monitors (CGMs)—uses direct concentration units: milligrams per deciliter (mg/dL) or millimoles per liter (mmol/L).
To make laboratory numbers easier to apply to daily life, the American Diabetes Association (ADA) utilizes a standard translation called Estimated Average Glucose (eAG). The eAG mathematically converts an abstract A1C percentage into the familiar tracking units seen on everyday meters. The relationship is calculated using the clinical formula: eAG (mg/dL) = (28.7 × A1C) − 46.7.
Type 2 Diabetes A1C to eAG Conversion Chart
| A1C Result (%) | Estimated Average Glucose (eAG) in mg/dL | Estimated Average Glucose (eAG) in mmol/L | Clinical Classification & Meaning |
| Normal (<5.7%) | 97 mg/dL | 5.4 mmol/L | Optimal metabolic health; low insulin resistance |
| Prediabetes (5.7%–6.4%) | 117–137 mg/dL | 6.5–7.6 mmol/L | High insulin resistance; significant risk of progressing to T2D |
| Diabetes (≥6.5%) | 140 mg/dL | 7.8 mmol/L | Official diagnostic threshold for Type 2 Diabetes |
| Target (7.0%) | 154 mg/dL | 8.6 mmol/L | Standard Therapeutic Target for most non-pregnant T2D adults |
| Action Needed (8.0%) | 183 mg/dL | 10.2 mmol/L | Blood sugar elevated; therapeutic adjustments recommended |
| High Risk (≥9.0%) | 212 mg/dL | 11.8 mmol/L | Severely elevated risk of rapid microvascular and nerve damage |
Setting Your Healthy A1C Goal: The Type 2 Spectrum
According to the official ADA Standards of Care in Diabetes, glycemic targets for Type 2 diabetes should never be a "one-size-fits-all" approach. Targets are highly individualized by clinicians based on how long you have had diabetes, your age, other health conditions, and your specific treatment path:
- Tight Glycemic Control (<6.5%): A lower target may be highly recommended for individuals who are younger, newly diagnosed, or managing their condition purely through intensive lifestyle changes or medications that do not cause low blood sugar (such as Metformin, SGLT2 inhibitors, or GLP-1 receptor agonists).
- Standard Target (<7.0%): This is the standard, well-established goal for most non-pregnant adults with Type 2 diabetes. Achieving a stable A1C below 7.0% provides powerful, proven protection against long-term microvascular and nerve damage.
- Relaxed Control (<8.0%): A more lenient target is clinically appropriate for older adults, individuals with a long history of Type 2 diabetes who struggle to achieve lower targets, those prone to severe low blood sugar (hypoglycemia) from insulin therapies, or individuals with advanced cardiovascular disease or kidney failure.
Reaching Type 2 Diabetes Remission
For many individuals newly diagnosed with Type 2 diabetes, active lifestyle intervention, weight loss, and metabolic therapies can reduce insulin resistance to a point where blood sugar returns to normal levels.
Per the consensus of the ADA and international diabetes societies, Type 2 Diabetes Remission is officially defined as maintaining a stable A1C of under 6.5% for at least 3 consecutive months without the use of any glucose-lowering diabetes medications.
Critical A1C Test Errors & Interferences in Type 2 Diabetes
While the laboratory A1C test is highly reliable, it relies entirely on the assumption that your red blood cells live a normal, predictable lifespan. Certain underlying medical conditions—many of which are highly prevalent in individuals with Type 2 diabetes—can alter red blood cell cycles, triggering falsely high or falsely low results.
Factors Causing Falsely High A1C Results
When red blood cells live longer than the standard 90-to-120-day window, they have more time to pick up glucose, artificially inflating your A1C reading:
- Iron Deficiency Anemia: A lack of iron slows down the production of new red blood cells, leaving an older population of heavily glycated cells in circulation. This is highly common in older adults or individuals with underlying nutritional imbalances. Vitamin B12 or folate deficiencies operate in a similar manner.
- Splenectomy: Surgical removal of the spleen reduces the body's natural filtering of older red blood cells, keeping highly glycated cells in your bloodstream longer.
Factors Causing Falsely Low A1C Results
When red blood cells are destroyed or replaced too quickly, the hemoglobin does not circulate long enough to interact with glucose, causing your A1C to appear misleadingly low:
- Chronic Kidney Disease (CKD): Advanced diabetic kidney disease often causes a severe drop in the hormone erythropoietin, leading to anemia. When patients receive iron injections or erythropoietin-stimulating agents (ESAs) to treat this, a rapid influx of new, un-glycated red blood cells artificially drops the A1C score.
- Shortened RBC Lifespan: Conditions like hemolytic anemia, significant active blood loss, or recent blood transfusions distort the typical cellular cycle.
Hemoglobin Variants
Inherited variants in hemoglobin structure—such as the HbS (sickle cell trait), HbC, HbE, or HbD traits—can directly interfere with specific laboratory equipment assays. If your routine home finger-sticks or continuous monitor averages are completely out of alignment with your quarterly lab report, ask your doctor to test your A1C using a method certified by the National Glycohemoglobin Standardization Program (NGSP), or to check alternative markers like glycated albumin or fructosamine tests.
Frequently Asked Questions (FAQ)
Can I lower my Type 2 diabetes A1C permanently?
Yes. Because Type 2 diabetes is driven heavily by insulin resistance, long-term modifications like a lower-glycemic diet, consistent physical activity (which allows muscles to absorb glucose without relying on insulin), and sustainable weight reduction can permanently lower your baseline A1C and help you maintain healthy levels.
Why does my doctor check my A1C every 3 months instead of once a year?
Because your red blood cells are entirely replaced over a 90-to-120-day window, a quarterly test offers the most accurate, updated look at your true multi-month blood sugar trends. Checking every 3 months tells your healthcare team exactly how well a new medication or dietary plan is working.
Can stress or a single heavy meal raise my A1C result?
No. An isolated stressful day or a single high-carbohydrate meal will cause a temporary spike on your daily glucose meter, but it will not noticeably impact a laboratory A1C test. The A1C measures a 3-month average, meaning it requires weeks of consistently elevated blood sugars to move the percentage upward.