
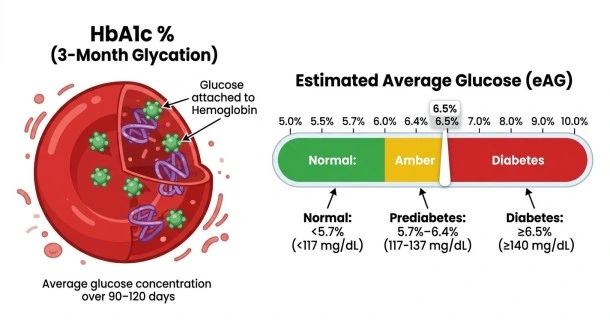
Convert your HbA1c percentage or mmol/mol into Estimated Average Glucose (eAG) in mg/dL and mmol/L. View the ADA HbA1c-to-blood-sugar chart and normal ranges.
HbA1c to Estimated Average Glucose (eAG) Calculator
Use this HbA1c to Estimated Average Glucose (eAG) Calculator to translate your 3-month HbA1c (glycated hemoglobin) lab result into the everyday blood sugar units (mg/dL and mmol/L) you see on a home glucose meter.
Convert Your HbA1c to Average Blood Sugar (eAG)
Enter your HbA1c value in either NGSP percentage (%) or IFCC units (mmol/mol) as shown on your laboratory report.
What Is Estimated Average Glucose (eAG)?
HbA1c measures the percentage of hemoglobin proteins in your red blood cells that are coated with glucose. Because red blood cells live for approximately 90 to 120 days, HbA1c reflects your overall blood sugar control over the past 2 to 3 months.
Estimated Average Glucose (eAG) converts that percentage into a familiar daily blood glucose concentration using the international ADAG (A1c-Derived Average Glucose) equation endorsed by the American Diabetes Association (ADA) and World Health Organization (WHO).
HbA1c to eAG Formulas & Unit Conversions
The clinical ADAG equations convert NGSP HbA1c (%) directly into average plasma glucose:
- eAG in mg/dL (US / India): (28.7 × HbA1c %) − 46.7
- eAG in mmol/L (UK / Canada / International): (1.59 × HbA1c %) − 2.59
- IFCC (mmol/mol) to NGSP (%): (0.09148 × HbA1c mmol/mol) + 2.152
- NGSP (%) to IFCC (mmol/mol): (10.93 × HbA1c %) − 23.50
HbA1c to Average Blood Sugar Conversion Chart
Use the reference table below to compare standard HbA1c levels with their corresponding IFCC values, Estimated Average Glucose (eAG), and clinical diabetes categories:
| HbA1c (%) | HbA1c (mmol/mol) | eAG (mg/dL) | eAG (mmol/L) | Clinical Interpretation |
|---|---|---|---|---|
| 5.0% | 31 mmol/mol | 97 mg/dL | 5.4 mmol/L | Normal |
| 5.5% | 37 mmol/mol | 111 mg/dL | 6.2 mmol/L | Normal (< 5.7%) |
| 5.7% | 39 mmol/mol | 117 mg/dL | 6.5 mmol/L | Prediabetes Threshold |
| 6.0% | 42 mmol/mol | 126 mg/dL | 7.0 mmol/L | Prediabetes |
| 6.4% | 46 mmol/mol | 137 mg/dL | 7.6 mmol/L | High Prediabetes Risk |
| 6.5% | 48 mmol/mol | 140 mg/dL | 7.8 mmol/L | Diabetes Diagnostic Threshold |
| 7.0% | 53 mmol/mol | 154 mg/dL | 8.6 mmol/L | Typical Adult Diabetes Target |
| 7.5% | 58 mmol/mol | 169 mg/dL | 9.4 mmol/L | Above General Target |
| 8.0% | 64 mmol/mol | 183 mg/dL | 10.1 mmol/L | Suboptimal Control |
| 9.0% | 75 mmol/mol | 212 mg/dL | 11.8 mmol/L | Elevated Complication Risk |
| 10.0% | 86 mmol/mol | 240 mg/dL | 13.3 mmol/L | High Complication Risk |
Note: For most non-pregnant adults with diabetes, major clinical guidelines recommend an HbA1c target below 7.0% (eAG < 154 mg/dL), though your doctor may set a stricter or more relaxed goal based on age and medical history.
Why Your eAG May Differ from Your Home Glucose Meter
Many people notice that their eAG is higher than the average of their home fingerstick readings. Common reasons include:
- Post-Meal Glucose Spikes: Most people test fasting blood sugar in the morning when glucose is lowest, whereas eAG captures 24-hour blood sugar—including after meals and overnight.
- More Recent Weighting: Blood glucose levels from the most recent 30 days account for roughly 50% of your HbA1c value, while earlier months contribute less.
- Whole Blood vs. Plasma Calibration: Lab HbA1c equations estimate plasma glucose, which runs slightly higher than capillary whole blood.
When HbA1c & eAG Can Be Inaccurate
Because HbA1c relies on red blood cell lifespan and hemoglobin structure, certain medical conditions can falsely raise or lower your score:
- Falsely Elevated HbA1c: Untreated iron-deficiency anemia, vitamin B12 or folate deficiency, and reduced red blood cell turnover can make HbA1c appear higher than actual average blood sugar.
- Falsely Lowered HbA1c: Hemolytic anemia, recent blood loss or blood transfusion, chronic kidney disease (CKD) on erythropoietin, and pregnancy can artificially lower HbA1c.
- Hemoglobin Variants: Sickle cell trait, thalassemia, or Hemoglobin C/E variants require specialized NGSP-certified lab assays (or fructosamine / Continuous Glucose Monitoring) for accurate assessment.
Frequently Asked Questions (FAQ)
What is a normal HbA1c and eAG level?
For people without diabetes, a normal HbA1c is below 5.7% (less than 39 mmol/mol), which equals an Estimated Average Glucose below 117 mg/dL (6.5 mmol/L). Levels between 5.7% and 6.4% indicate prediabetes, and 6.5% or higher on two separate tests indicates diabetes.
Why is my eAG 140 mg/dL when my fasting blood sugar is 115 mg/dL?
Your fasting reading only shows your blood sugar after an overnight fast. Your eAG reflects your 24-hour average—including blood sugar rises after breakfast, lunch, and dinner—so eAG is typically 15 to 30 mg/dL higher than morning fasting readings alone.
Do I need to fast before an HbA1c blood test?
No. Unlike a fasting plasma glucose test, an HbA1c test measures glucose bound to red blood cells over 2 to 3 months and can be drawn at any time of day without fasting.
How fast can I lower my HbA1c and eAG?
Because red blood cells turn over every 90 to 120 days, meaningful changes in HbA1c take 8 to 12 weeks of consistent diet, physical activity, and prescribed medication adjustments to appear on a lab test.